SRHE Blog

The Society for Research into Higher Education


Leave a comment

When will the underrepresentation of Black professors end?

by Zarus Cenac

On the SRHE Blog, in May and July, I wrote about the underrepresentation of Black people amongst professors in the UK higher education sector. In response to my May blog post, a commentator brought up the idea of a time delay between “the demographics of academia” and “changes in the wider population”, and that “estimating what is a reasonable lag is challenging and probably highly contestable” (Golding, 2026, para. 1). The present blog post takes a step along that path. There is an underrepresentation of Black female professors and Black male professors (Paper Whispers, 2025; Figure 1) – for females and males separately, I estimate how many years it may take for the underrepresentation of Black professors to end (Figure 2). This is done by estimating when the percentage of professors who are Black will eventually match Black representation in part of the UK population who are around a certain age (Figure 2). I also look for an indication of whether underrepresentation has been tangibly improving for Black female professors and Black male professors (Figure 2). Additionally, I consider which is the better of two similar methods for calculating the percentage of professors who are Black (eg, Figure 4a and 4b).

Figure 1

The Underrepresentation of Black Female Professors and Black Male Professors in UK Higher Education Institutions
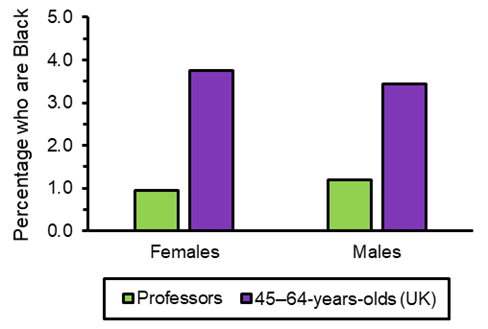
A bar chart is shown – for females, .95% of professors are Black and 3.75% of 45-to-64-year-olds are Black. As for males, Black people are 1.19% of professors and 3.44% of 45-to-64-year-olds.

Note. Data (2024–25 academic year) from Higher Education Statistics Agency (HESA, nd-a) and 2021/2022 UK Census data (Office for National Statistics, 2025) were used regarding Figure 1 and in analysis. As before, statistical analysis was used to explore the representation of Black professors – see Box 1 for a description of this analysis.

Black representation over time: Professors

There have been observations on what the representation of Black professors looks like at different points in time (eg, Gibney, 2024; Rollock, 2025). For instance, between the 2021–22 and 2022–23 academic years, there was a 0.2% increase in the percentage of professors who are Black, with the percentage being 0.9% in 2022–23 (Gibney, 2024), and the percentage of female professors who are Black was 0.6% in 2019–20 and 0.8% in 2022–23 (Rollock, 2025).

I used HESA data for the academic years 2014–15 to 2024–25 (HESA, nd-a) to calculate the percentage of professors who are Black amongst females and amongst males (the green circles in Figure 2). Based on representation across those academic years, predictions were made for Black representation in academic years after 2024–25 by fitting a (quadratic) trendline to the data for females and for males – the trendline is the green, dotted line in Figure 2. Despite trendlines predicting a continued increase in Black representation in the professoriate, it should be expected that the percentage will plateau at some point (see the plateauing indicated in Figure 3 regarding non-professors).

Figure 2

Predicting When Black Professors are no Longer Underrepresented
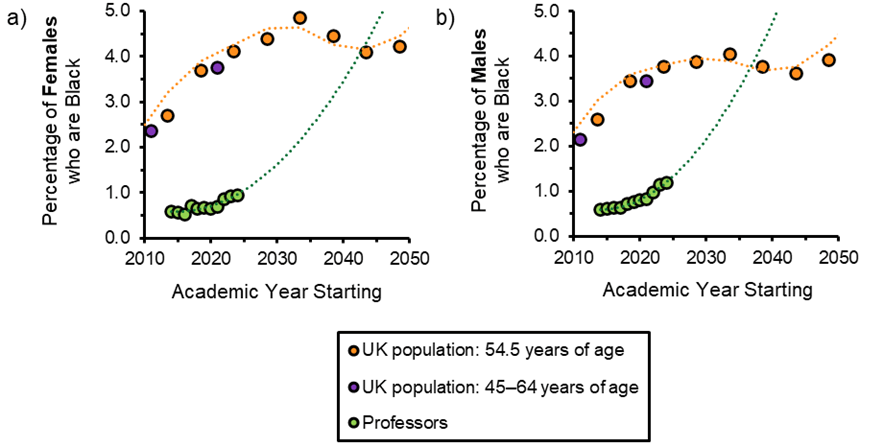
Scatter graphs showing the academic year when the representation of Black people amongst professors is predicted to match Black representation in 54.5-year-olds for females and males. That academic year is about 2043–44 and 2037–38 respectively for females and males.

Note. Underrepresentation is predicted to end in the academic year when dotted lines cross. HESA (nd-a) data and 2021/2022 UK Census data (Office for National Statistics, 2025) were used for Figures 2 and 4. HESA (nd-a) state the number of professors by ethnicity categories: Asian, Black, Mixed, Other, White, and unknown ethnicity. In Figure 2 (and Figure 1), the representation of Black professors was calculated only using persons of known ethnicity. Additionally, using Census data (Nomis, 2013; Office for National Statistics, 2025), for females and males, Black representation amongst 45-to-64-year-olds in the UK was i) estimated for 2011 and ii) calculated for 2021/2022 (Box 2). For simplicity, census year (Office for National Statistics, 2025) was treated as the year when the academic year starts, eg, with the 2021/2022 Census data treated as the 2021–22 academic year.

Black representation over time: 54.5-year-olds in the UK population

The representation of Black people is lower in the professoriate than amongst people in the UK population who are between 45 and 64 years old – an age range which should reflect the ethnic composition of the professoriate well enough (Cenac, 2026). The midpoint of this age range is 54.5 years of age. For females and males, UK Census data are available for various ages and age ranges, for example, 15 years old, 50-to-54 years old, and 65-to-69 years old (Office for National Statistics, 2025). I estimated the year when ages and age ranges are 54.5 years old. To estimate when an age range is 54.5 years old, I calculated the midpoint of the age range, for example, the midpoint for the 50-to-54 age range is 52 years – the midpoint was used to represent the entire age range.

For ages and age ranges, UK Census data (Office for National Statistics, 2025) were used to calculate the percentage of females and males in the UK population who are Black. Figure 2 shows those percentages and the year in which the age/midpoint is 54.5 years old (orange circles). To estimate/predict what Black representation is like amongst 54.5-year-olds in the UK population for females and males at various times, a moving average line was used – the line can be seen in Figure 2 as a line which is orange and dotted.

The estimated representation of Black people amongst 54.5-year-olds seems to be acceptable as a stand-in for Black representation in 45-to-64-year-olds in the UK in the recent past if we consider representation in 45-to-64-year-olds in 2021/2022 and estimated representation in 45-to-64-year-olds in 2011 (see Box 2).

Figure 3

Level of Black Representation in Non-Professors

Scatter graphs present the percentage representation of Black people amongst non-professors for females and males for the academic years 2014–15 to 2024–25. For females, percentage representation goes from 1.51% in 2014–15 to 3.61 in 2024–25. For males, Black people were 2.10% of non-professors in 2014–15, rising to 4.88% in 2023–24, and at 4.86% in 2024–25.

Note. Data (which are of academics who are not professors) are from HESA (nd-a), and percentage representation was calculated from non-professors whose ethnicity is known.

Predicting an end to underrepresentation

The ethnic diversity of the UK has been predicted to be higher in 2051 than it was in 2001 (Rees et al, 2011). So, it should not be surprising that Black representation amongst 45-to-64-year-olds seems to have been increasing (see the purple circles in Figure 2). Therefore, when examining whether the underrepresentation of Black professors is improving, it is important to take into consideration changes in representation within the UK population (Figure 2). For females and males, between the academic years 2014–15 and 2024–25, the increase in the representation of Black professors does not seem to outpace the estimated increase in the representation of Black people who are around 54.5-years-old (Figure 2). Therefore, between those academic years, there appears to have been no tangible improvement in the underrepresentation of Black female professors and Black male professors.

It is possible to estimate the academic year when there will no longer be an underrepresentation. This can be done by seeing the academic year when dotted lines for professors and 54.5-year-olds cross over each other. That academic year is approximately 2043–44 for Black female professors and approximately 2037–38 for Black male professors. So, in the 2026–27 academic year, we are an estimated 17 years away from underrepresentation disappearing for Black female professors, and an estimated 11 years away for Black male professors.

Gains in Black representation amongst female and male academics who are not professors (Figure 3) suggest that there is reason to be optimistic that Black representation in the professoriate will increase for females and males. However, if Black representation amongst female non-professors is plateauing (at around 3.6%), then the trend amongst female non-professors (Figure 3a) does not bode well for an end to the underrepresentation of Black female professors by the early-to-mid 2040s (Figure 2a).

The percentage of professors who are Black, and the prediction of when underrepresentation disappears, depends on which of two (slightly different) methods is used to calculate the percentage (Figures 2 and 4). Using HESA data, the percentage of professors who are Black is calculated by dividing the number of Black professors by some sort of total number (eg, Gibney, 2024), and the two methods differ in how this total is defined (Figures 2 and 4).

Method 1: Known ethnicity only. When calculating the percentage representation of an ethnic group, or ethnic groups, the percentage can be calculated just from individuals for whom ethnicity is known (eg, HESA, 2026a). So, in this method, people of unknown ethnicity are not included in the total when calculating the percentage of professors who are Black (eg, Gibney, 2022; Figure 2).

Method 2: Overall. From looking at HESA (nd-a, 2026a) data, there seem to have been times when the percentage of professors who are Black (eg, Essilfie-Quaye et al, 2025; Gibney, 2024), or the percentage of female professors who are Black (Rollock, 2025), was calculated from a total number which includes people whose ethnicity is unknown. Under that method, when a percentage is calculated, a Black person could be part of the Black category or part of the unknown ethnicity category.

Compared to Method 1, Method 2 leads to a slightly lower percentage of professors who are Black (Figure 4a and 4b; also see Le Roux, 2022), and predicts that underrepresentation disappears a little further into the future (Figures 2 and 4). As briefly covered in my second blog post, the percentage of professors who are Black may seem smaller (but not very much smaller) than it really is. Method 2 would lead to a slightly further underestimation than Method 1 (Figure 4a and 4b). So, Method 1 may be a somewhat better method than Method 2 for considering the percentage representation of Black professors (eg, see Le Roux, 2022) and for estimating when underrepresentation will end.

Figure 4

Different Methods of Calculating the Percentage of professors who are Black
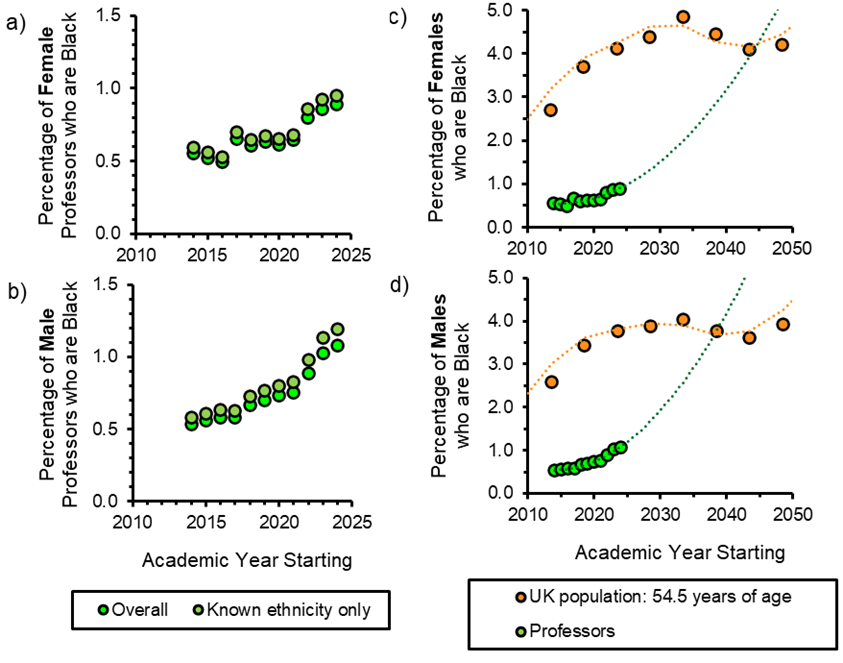
It is demonstrated, in scatter graphs, that Method 2 calculates a lower level of Black representation in the professoriate than Method 1 does for females and males. Other scatter graphs represent the prediction of the academic year when the underrepresentation of Black professors ceases, for females and males, under Method 2.

Note. For Figure 4c and 4d, analysis regarding Figure 2 was undertaken again, but without limiting analysis to professors of known ethnicity – it is predicted that Black professors will no longer be underrepresented by 2045–46 for females and 2038–39 for males. Considering data and literature (HESA, nd-a; Rollock, 2025), some of the percentages for Black female professors (overall) in Figure 4a are in Rollock (2025) to one decimal place.

Context and future research

There seems to be a dearth of literature which examines how percentage representation changes with time in academia and in the national population to see whether the extent of ethnic/racial underrepresentation in academia changes. So, it is hoped that the approach used in the present blog (Figure 2) is useful for exploring the underrepresentation of ethnic/racial groups in academia outside of Black professors. In previous research, a graph has shown 1) the number of geoscience PhDs gained by people in specific (underrepresented) ethnic/racial groups for various years (amongst the USA’s citizens or people with permanent residency in the country) and 2) the number of people in ethnic/racial groups in the USA for various years (Bernard & Cooperdock, 2018). The graph has been referred to when stating that, when considering four decades, “the representation of students from underrepresented minorities … has essentially been stagnant when compared with the proportion of the relevant groups in the US population” (Bernard & Cooperdock, 2018, pp. 292–293); the present blog post examines the percentage representation of Black people in the professoriate and in the UK population (Figure 2) – if not done so already, it may be useful to examine (across the years) the percentage representation of ethnic/racial groups in academia beyond the Black professoriate (eg, in achieving PhDs) alongside percentage representation at the national population level for an indication of whether ethnic/racial underrepresentation is changing and when the underrepresentation may stop.

In my first blog post, I described how a statistic known as Cohen’s h can quantify the extent that Black professors are underrepresented, and I considered how that statistic can be used to define when underrepresentation is no longer large enough to be noteworthy. Therefore, Cohen’s h could be used to estimate the academic year when the difference between Figure 2’s orange and green lines is no longer noteworthy – that year would likely be sooner than the year when underrepresentation is forecasted to stop.

Whilst this blog post predicts when underrepresentation will end for Black female professors and Black male professors (Figure 2), these predictions are not intended to be conclusive. Ideally, future census data (Northern Ireland Statistics and Research Agency, 2026; Office for National Statistics, 2026; Scotland’s Census, 2025) and HESA data (HESA, 2026b) will be used to update these predictions in the approaching years. Moreover, previous research on predicting the future representation of ethnic groups in the UK (Rees et al, 2011) suggests that the method for predicting an end to underrepresentation (Figure 2) can be refined.

Conclusion

There has been an increase in the percentage of the professoriate who are Black (Gibney, 2024). Nevertheless, there does not appear to have been a reduction in the underrepresentation of Black female professors or Black male professors between 2014–15 and 2024–25 (Figure 2). Despite this lack of reduction in underrepresentation, it is provisionally predicted that the underrepresentation of Black female professors and Black male professors will end in 2043–44 and 2037–38 respectively. However, the prediction for Black female professors seems unlikely given the plateauing indicated in the representation of Black female non-professors (Figure 3a). Hopefully, predictions will be strengthened through subsequent data and improved methodology; it is intended that this blog post encourages efforts to monitor and predict the underrepresentation of Black professors over time so that there can be a clear idea of where the situation is heading.

Box 1

Statistical Analysis: Underrepresentation

Data and analysis. Data of professors in UK higher education institutions for the 2024–25 academic year (HESA, nd-a), and UK Census data from 2021/2022 censuses (Office for National Statistics, 2025), were analysed. R Version 4.5.2 (R Core Team, 2025) was used to run z-tests – tests for seeing if there is a statistically significant underrepresentation – and to calculate Cohen’s h effect sizes (Cohen, 1988; Zieffler, 2025) – to signify the magnitude of the underrepresentation. A z-test found that, statistically, the representation of Black females is significantly lower in female professors than amongst females who are between 45 and 64 years of age (2(1) = 171.08, p < .001, Cohen’s h = .19). Likewise, a z-test demonstrated that Black males are significantly less represented amongst the male professoriate than they are amongst 45-to-64-year-old males (2(1) = 241.78, p < .001, Cohen’s h = .15). Cohen’s hs indicated that these underrepresentations are not negligible (see my first blog post). Caveats. Between 2021/2022 and 2024, there probably was a slight increase in the representation of Black females and males amongst 45-to-64-year-olds (Figure 2). So, comparing 2024–25 data of professors to 2021/2022 census data (as was done in the present blog) is likely to somewhat underestimate the underrepresentation. Probably, the number of individuals in HESA’s professor category does not reach up to the actual total of professors (HESA, nd-b). However, as discussed in my second blog post, the percentage of Black people in that category likely does well enough as a stand-in for the actual percentage of professors who are Black. It should be mentioned that whilst the proportion of professors who are female has risen, females nevertheless account for a minority of professors (Advance HE, 2024), with 32% being female in the 2024–25 academic year and the majority being male (HESA, 2026a) – in the current analysis, percentages were calculated separately for females and males.

Note. References: Advance HE (2024), Cohen (1988), HESA (nd-a, nd-b, 2026a), Office for National Statistics (2025), R Core Team (2025), Zieffler (2025), my first and second blog posts.

Box 2

Black Representation in 45-to-64-year-olds in the UK: 2011 and 2021/2022
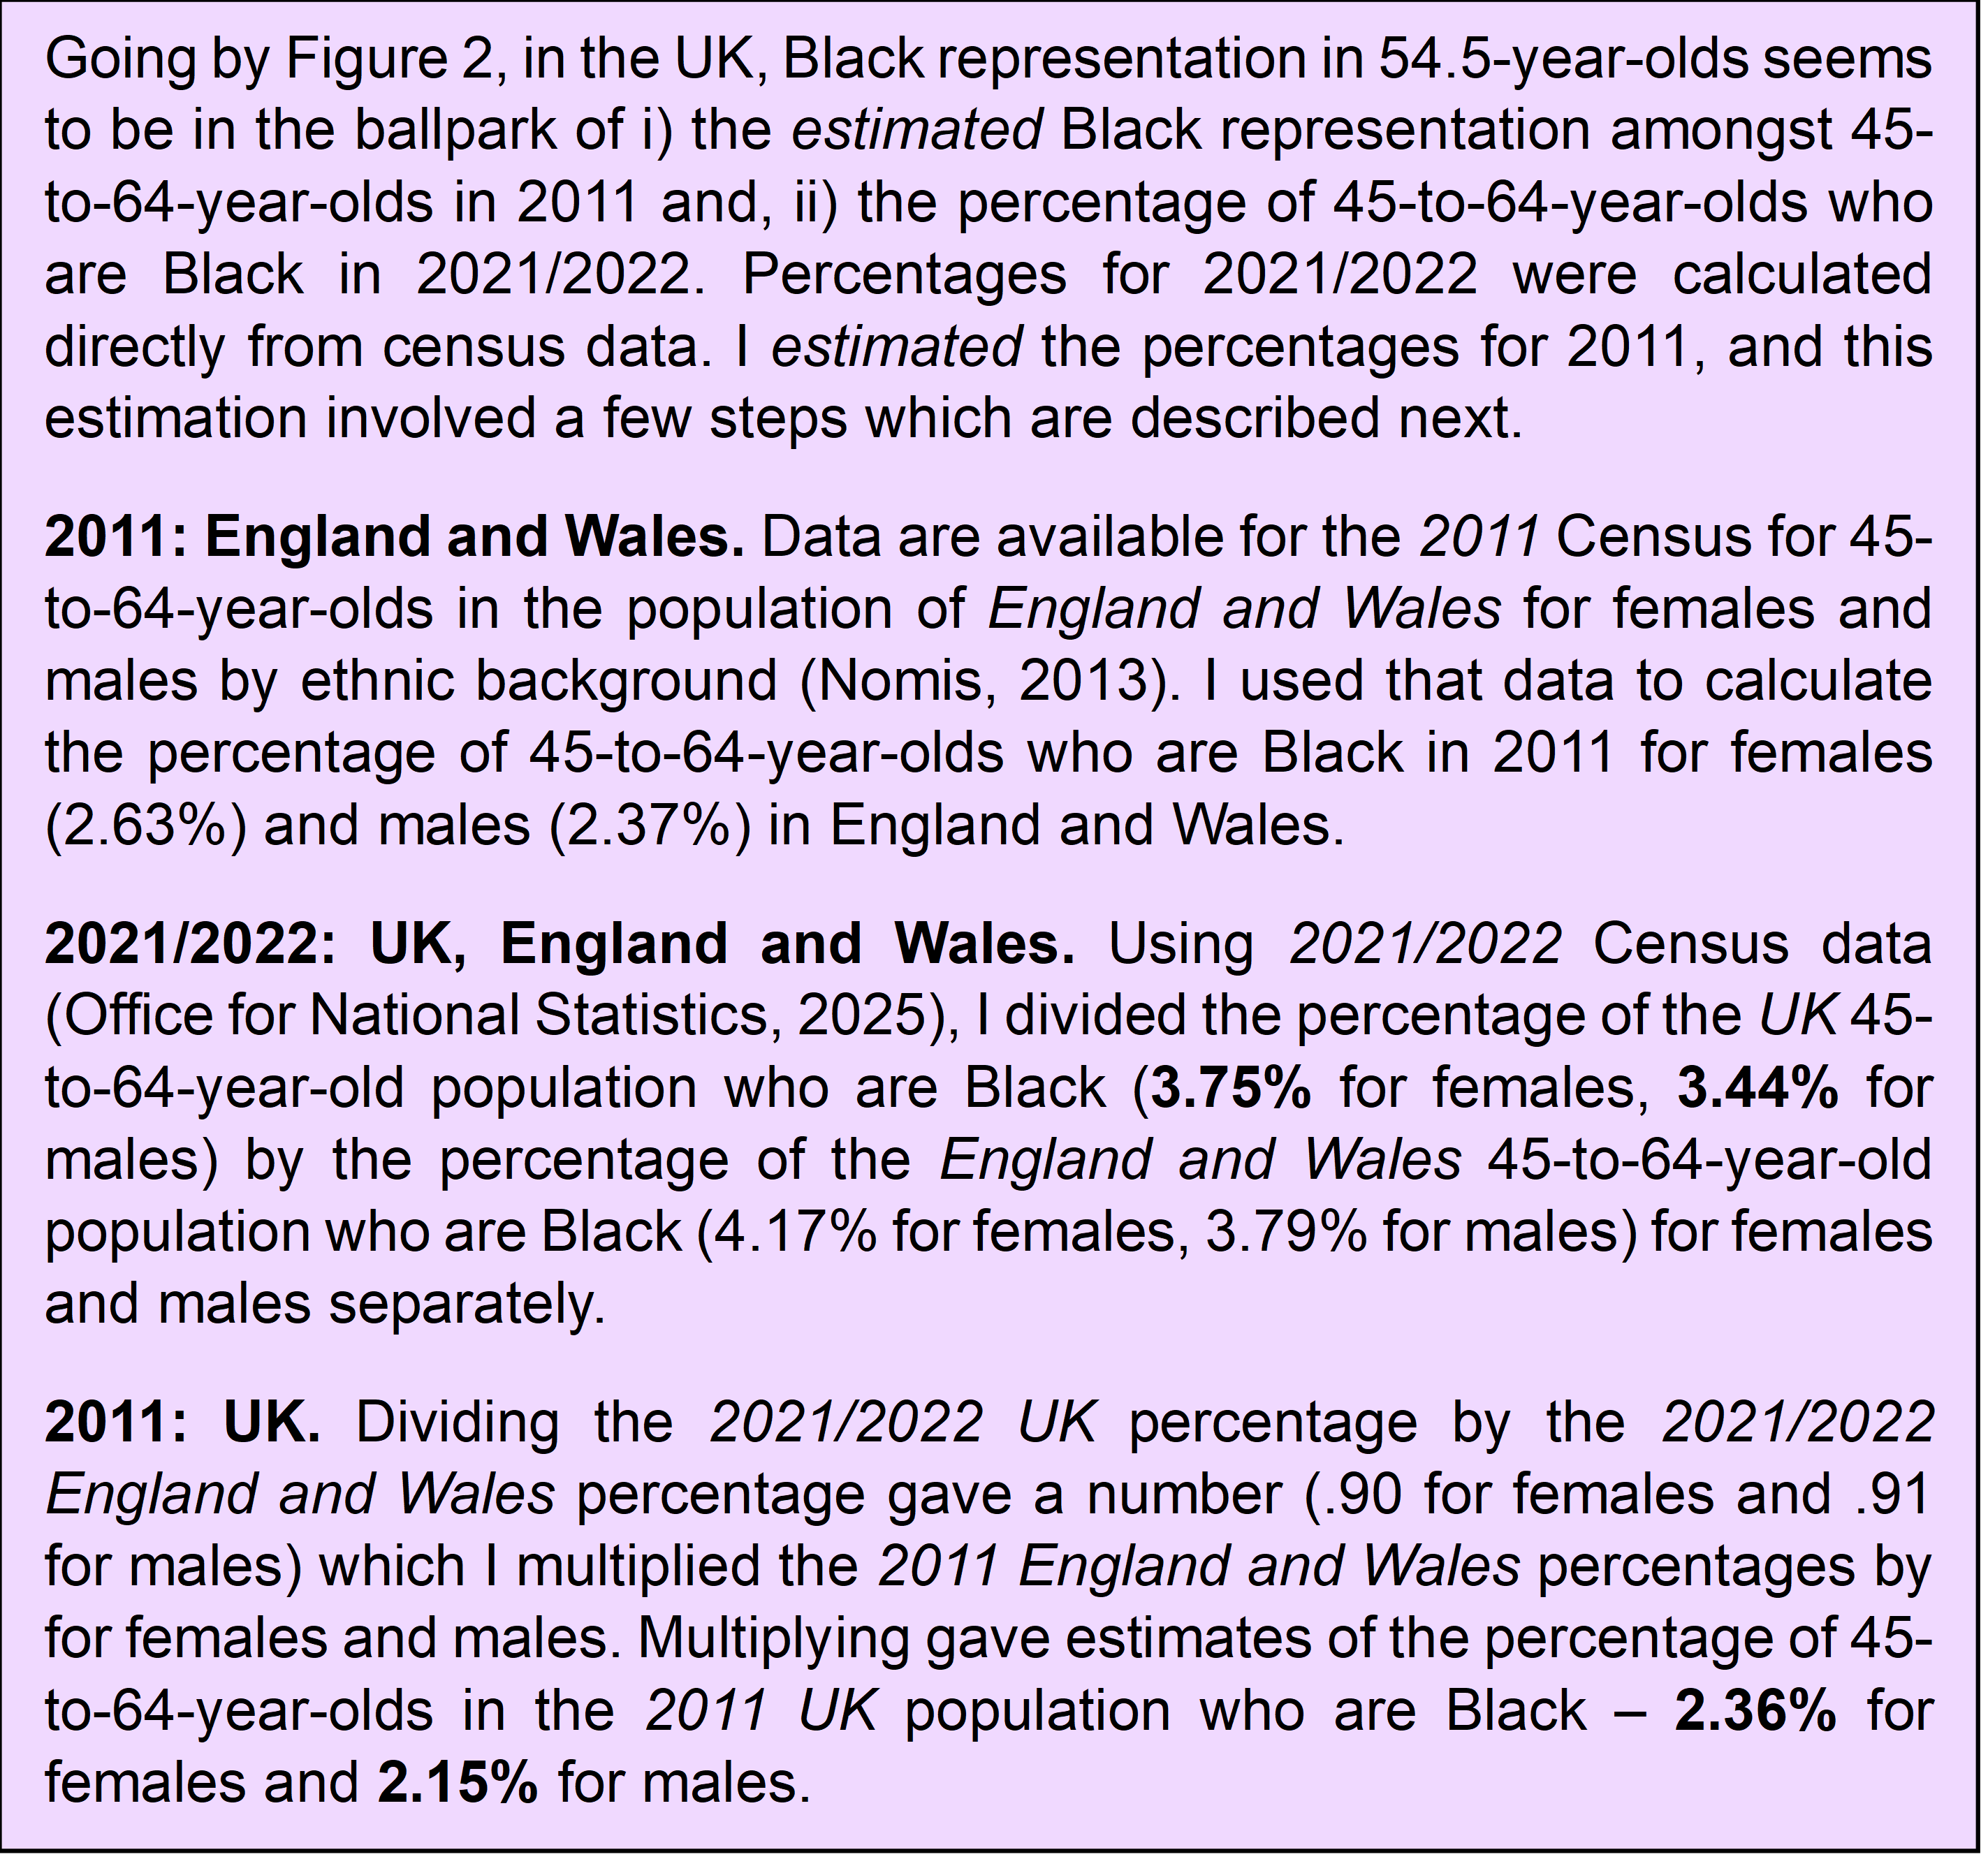
Going by Figure 2, in the UK, Black representation in 54.5-year-olds seems to be in the ballpark of i) the estimated Black representation amongst 45-to-64-year-olds in 2011 and, ii) the percentage of 45-to-64-year-olds who are Black in 2021/2022. Percentages for 2021/2022 were calculated directly from census data. I estimated the percentages for 2011, and this estimation involved a few steps which are described next. 2011: England and Wales. Data are available for the 2011 Census for 45-to-64-year-olds in the population of England and Wales for females and males by ethnic background (Nomis, 2013). I used that data to calculate the percentage of 45-to-64-year-olds who are Black in 2011 for females (2.63%) and males (2.37%) in England and Wales. 2021/2022: UK, England and Wales. Using 2021/2022 Census data (Office for National Statistics, 2025), I divided the percentage of the UK 45-to-64-year-old population who are Black (3.75% for females, 3.44% for males) by the percentage of the England and Wales 45-to-64-year-old population who are Black (4.17% for females, 3.79% for males) for females and males separately. 2011: UK. Dividing the 2021/2022 UK percentage by the 2021/2022 England and Wales percentage gave a number (.90 for females and .91 for males) which I multiplied the 2011 England and Wales percentages by for females and males. Multiplying gave estimates of the percentage of 45-to-64-year-olds in the 2011 UK population who are Black – 2.36% for females and 2.15% for males.

Note. References: Nomis (2013), Office for National Statistics (2025).

References

Cohen, J. (1988). Statistical power analysis for the behavioral sciences (2nd ed.). Lawrence Erlbaum Associates.

Zarus Cenac has worked at UK universities, for example, he was a visiting lecturer at City, University of London. He is currently an administrator at UCL. His interests include race and ethnicity from an interdisciplinary perspective.


Leave a comment

Do we know how many Black professors there are in UK higher education?

by Zarus Cenac

UK higher education is known to have too few Black professors (eg Hubbard, 2026). The presence of Black professors can be thought about by looking at 1) the number of Black professors or 2) the percentage of professors who are Black (Adisa et al, 2025; Gibney, 2024). The number/percentage has been referred to, for instance, in journal articles (Adisa et al, 2025; Arday, 2022), the media (Coughlan, 2021), and in the House of Lords (House of Lords, 2025). We can keep an eye on the number, or the percentage, to have an idea about if the situation is improving (Gibney, 2024; Nowell, 2025). So, is it not vital that we have accurate numbers and percentages? In a recent post on SRHE Blog, I considered how to statistically analyse the representation of Black professors in different ways –analyses showed that Black professors are underrepresented (Cenac, 2026a). In the present blog post, I discuss issues with the apparent number of Black professors and the apparent percentage of professors who are Black – this blog post asks if we actually know the number and the percentage (Figure 1), and this blog post considers if we really should say that Black people are underrepresented in the professoriate.

Figure 1: Factors Which May Affect Our Measurement of the Black Presence in the Professoriate

Note. Figure 1 is based on the literature/data (Dembosky et al, 2019; HESA, 2026; Gibney, 2022). See the main text for full explanations. HESA is the Higher Education Statistics Agency (HESA, nd-a).

The number of Black professors

When people wish to say how many Black professors there are, a source they can use is the Higher Education Statistics Agency (HESA) (eg Essilfie-Quaye et al, 2025; Gibney, 2024) who “are the experts in UK higher education data” (HESA, nd-a, para 1). However, there are two points to consider: firstly, we should be mindful of how HESA categorises an academic as a professor (HESA, nd-b), and, secondly, ethnicity is unknown for a proportion of professors in the HESA data (HESA, 2026). Those two points are discussed next.

Professors in HESA data

In the HESA data, a professor may be classified as a professor (HESA, 2026, nd-c). Alternatively, a professor can be categorised into a different senior group for academics, for example, if the professor’s role is managerial (HESA, 2026; nd-c). So, there is a good chance that the HESA professor category shows us fewer professors than there truly are, and HESA are open about this (HESA, 2026) – see Figure 2. The different senior group is not limited to professors (HESA, 2026, nd-b); from looking through the HESA website (HESA, nd-b; 2024, 2026), HESA seem not to have data which specifies how many professors there are in the different senior group (eg overall or for Black professors).

Going by HESA data (HESA, 2024; 2026) and literature on the presence of Black professors, we can see instance after instance where the number of Black professors (eg Arday, 2022; Essilfie-Quaye et al, 2025; Gibney, 2024; Nowell, 2025) seems to have been derived from the HESA professor category, and (to my knowledge) without mentioning the issue that the HESA professor category may not include all professors because some professors are potentially being put into the different senior group. If awareness of this issue is not as good as it should be, perhaps HESA should consider if the issue could be communicated more obviously, for example, referring to it just before/after the table in HESA (2024) or HESA (2026) which breaks down the HESA professor category by ethnic group.

Figure 2: Black Female Professors

Note. Figure 2 refers to WHEN Equality (2026) and uses data from HESA (nd-d).

Unknown ethnicity

Ethnicity is not known for all academics in the HESA professor category (HESA, 2026). For example, ethnicity it is not known for 2,210 of those professors in the 2024–25 academic year (HESA, 2026). Because of this, we really should expect the number given for Black professors in the HESA professor category to be fewer than the true number of Black professors.

The percentage (proportion) of professors who are Black

If we want to see how well Black professors are represented, we can look to the percentage or proportion of people in the HESA professor category who are Black (eg Adisa et al, 2025; Cenac, 2026a; Essilfie-Quaye et al, 2025). For instance, statistical analyses (of people whose ethnicity is known) indicate that Black people are substantially less represented in the HESA professor category than they are in 1) the UK working-age population overall (Cenac, 2026a), and 2) an older section of the UK working-age population (Cenac, 2026b). Next, we will consider (in two ways) if percentages (proportions) from the HESA professor category actually are useful for looking into the representation of Black academics.

Professors in the HESA data

As covered earlier in this blog post, in the HESA data, professors can be in the professor category or the different senior group (HESA, 2026). We do not know if the percentage of professors who are Black would be different in the HESA professor category than it is for professors in the HESA different senior group. In the HESA data, professors with (at least) a certain level of seniority will not be categorised as professors, instead being put into the different senior group (HESA, 2026). Black representation is known to decrease the higher up people are in the academic hierarchy, from undergraduate student to professor (eg Gibney, 2022). So, it would not be surprising if Black representation is greater amongst the HESA professor category than amongst professors in the different senior group. Therefore, the percentage of Black people in the HESA professor category could be higher than the true percentage of professors who are Black. This means that the notable underrepresentation of Black people in the HESA professor category (Cenac, 2026a) would likely be found even if analysis included professors from the different senior group.

On the other hand, out of people whose ethnicity is known, Black people are 1.13% of the HESA professor category in 2024–25 (Cenac, 2026a), but 1.69% of the different senior group in the HESA (2026) data for 2024–25. So, it might not be the case that Black people are represented worse in the HESA professor category than they are amongst professors in the different senior group.

In the HESA (2026) data for 2024–25, there are nearly four times as many people in the professor category than in the different senior group. Therefore, findings with the HESA professor category are likely to be representative of what is happening with professors in general. So, it does seem useful to use percentages from the HESA professor category if we wish to know about the representation of Black professors.

Unknown ethnicity

Ethnicity is not known for some academics in the HESA data (HESA, 2026). When it comes to people giving their racial or ethnic background in a survey, some people refrain from giving their background (Dembosky et al, 2019). This refraining is suggested to not be the same across different backgrounds, with results indicating that Black people refrain the most whilst the group who refrain the least are White people who are other than Hispanic (Dembosky et al, 2019). If Black professors hold back on declaring their background more than other groups of professors, that could make it seem like the percentage of professors who are Black is lower than it truly is. However, the difference in the rate at which Black people and non-Hispanic White people refrain from giving their background (in a survey) is suggested to not even be 4% (Dembosky et al, 2019) – a difference in rates would probably not be an issue when it comes to using the HESA professor category for looking into the representation of Black professors.

Conclusion

The HESA professor category probably does not show us how many Black professors there really are, giving us a number which is lower than the true number of Black professors (eg Figure 2). Although HESA are forthcoming about how professors can be partitioned between the HESA professor category and the different senior group (eg HESA, 2026), HESA should consider if they can convey this better. Even if there truly are more Black professors than the HESA professor category suggests, this blog post is not implying that Black academics are well represented in the professoriate. Overall, the percentage (proportion) of Black professors in the HESA professor category shows a marked underrepresentation (Cenac, 2026a), and, as discussed above, that percentage should give us a good indication of the true representation (the underrepresentation) of Black professors despite factors which may somewhat affect how good the percentage is at indicating how the situation really is (Figure 1). So, when the HESA professor category is used to explore the presence of Black professors, far more emphasis should be put on the percentage or proportion of professors who are Black rather than the number of Black professors.

Zarus Cenac has worked at UK universities, for example, he was a visiting lecturer at City, University of London. He is currently an administrator at UCL. His interests include race and ethnicity from an interdisciplinary perspective.


1 Comment

Leadership in a Changing Landscape

by Jane Creaton

This introductory post is part of a series linked to a Symposium on Leadership in a Changing Landscape, which was held at the SRHE Annual Research Conference in December 2019. This symposium aimed to examine different dimensions of, and perspectives on, leadership in the changing landscape of higher education. Each of the contributions, and the reflections on the discussions that followed, will be summarised here on the SRHE blog over the next four weeks.  Drawing on a range of research projects and practice initiatives, the contributors will explore the career trajectories, motivations, challenges and identities of senior leaders in both research-intensive and teaching focussed universities.

The various projects sought to understand why people aspire to or take up senior leadership roles, how they manage different aspects of the work and the different approaches that are taken to the role. Aligning with the theme of the 2019 conference, the contributions also considered the potential for critical and creative leadership within the academy. In the increasingly measured and managed higher education sector, is it possible for leaders to develop distinctive approaches to leadership and/or to challenge the ideological underpinning of managerialism?

There are a number of key themes running through this diverse set of contributions, including what constitutes good leadership, how leaders can be supported and developed, and the affective dimensions of leadership. Some of the specific questions that we discussed in the symposium, which drew together findings from the projects and our own reflections on leadership from our perspective within higher education institutions, included:

1. What might ‘creative leadership’ or ‘critical leadership’ look like in higher education?

2. How can we challenge dominant discourses of leadership based on predominantly managerially based models and explore new, more flexible, human-focused and compassionate approaches to academic leadership?

3. How might aspiring professors be better prepared for professoriate leadership challenges?

Claire Gordon and Jane Creaton: The role of heads of departments

In our blog post, we will discuss an ongoing project that explores the working practices of heads of academic departments and the institutional policies and practices required to support them. Through interviews with HoDs across the sector, we analyse the key factors impacting on how the role is experienced and enacted, including disciplinary context, institutional structure and type of university. The project is also concerned with the extent to which current leadership and management programmes provide adequate preparation and support for a role which may be particularly vulnerable to work-related stress (Floyd and Dimmock, 2011; Creaton and Heard-Laureote, 2019). The initial analysis of interviews has produced a rich mix of metaphors and analogies to describe the role that have the potential for a more creative approach to leadership development.

Alan Floyd: Exploring notions of ‘good’ academic leadership in challenging times

Due to the nature of academic work, it is accepted that leaders cannot be effective without the support of their departmental colleagues (Floyd and Fung, 2017). Consequently, academic leadership is seen more as ‘the property of the collective rather than the individual’ (Bolden, Petrov, and Gosling, 2009: 259). Arguably, ‘distributing’ and sharing leadership is even more important in universities than in other organisations as academics are well educated, largely autonomous and trained to be highly critical. This means they are more likely to oppose and challenge more traditional leadership models and behaviours and may need a subtler form of leadership than other occupational groups (Bryman, 2007). In my blog post, I will draw on data from projects that have explored more flexible ‘distributed’ and ‘collaborative’ models of leadership, crucially focusing on data from both leaders and the led, to explore academics’ expressed notions of ‘good’ academic leadership in times of change and challenge.

Julie Hulme and Deborah Lock: Professors in preparation: supporting 21st century professorial leaders

Becoming a professor is not easy but for some reason becoming a professor in teaching and learning appears to be harder than most. Part of this is because there is no consensus about what a pedagogic professor looks like, and part of this is linked to uncertainty about appropriate selection criteria, and the type of evidence required to demonstrate professorial behaviours and activities (Evans, 2015). There is a lack of guidance and role (and real) models that aspiring professors (education, scholarship and/or professional practice) can turn to for advice about teaching and learning career pathways (Evans, 2017). The Professors in Preparation network is aimed at providing aspiring professors with a supportive community through which the pooling of knowledge through the sharing of ‘lived’ experiences, and identity stories aids successful applications (Waddington, 2016; Macfarlane and Burg, 2019). The network is based on the premise of a virtuous circle in which members that achieve professorship continue to contribute feedback and provide support to the next generation of professors. In our blog post, we will explore what we should expect from the 21st Century professoriate and how we could we reposition the status of educational and scholarship professors and help them become leaders of Trojan Mice instead of Cinderella followers.

Fiona Denney: What I wish I’d known” – academic leadership in the UK, lessons for the next generation

This blog post will discuss the results from a research project funded by the UK’s Leadership Foundation for Higher Education’s Innovation and Transformation Fund in 2015. 18 academics in leadership positions were interviewed about their leadership experiences and what they wished they had known before taking up their leadership posts. Eight themes and information about the context within which they lead were identified and are presented with a discussion of how this contributes to our understanding of the development of those who aspire to leadership positions in higher education. Literature has focused on the importance of prestige for promotion which can leave academic leaders unprepared for the other challenges of their role (Blackmore, 2015; Kandiko-Howson and Coate, 2015). I will also identify challenges and themes which can be used to better prepare the next generation of academic leaders.

Jane Creaton is Associate Dean (Academic) for the Faculty of Humanities and Social Sciences and a Reader in Higher Education at the University of Portsmouth. She has been a member of the SRHE Governing Council since January 2019.

References

Blackmore, P (2015) Prestige in universities: in tension with the efficiency and effectiveness agenda? Paper presented at the Society for Research into Higher Education Annual Research Conference, Newport, UK

Bolden, R, Petrov, G and Gosling, J (2009) ‘Distributed leadership in higher education: rhetoric and reality’, Educational Management Administration and Leadership https://doi.org/10.1177/1741143208100301

Bryman, A (2007) ‘Effective leadership in higher education: a literature review’, Studies in Higher Education, 32(6): 693-710, https://www.tandfonline.com/doi/abs/10.1080/03075070701685114?journalCode=cshe20  

Creaton, J and Heard-Laureote, K (2019) ‘Rhetoric and reality in middle management: the role of heads of academic departments in UK universities’, Higher Education Policy https://doi.org/10.1057/s41307-018-00128-8

Floyd, A and Fung, D (2017) ‘Focusing the kaleidoscope: exploring distributed leadership in an English university’, Studies in Higher Education https://doi.org/10.1080/03075079.2015.1110692

Evans, L (2015) The purpose of professors: professionalism, pressures and performance Stimulus paper commissioned by the Leadership Foundation for Higher Education, Leadership Foundation for Higher Education

Evans, L (2017) ‘University professors as academic leaders: professorial leadership development needs and provision’, Educational Management Administration and Leadership 45(1): 123–140

Floyd, A and Dimmock, C (2011) ‘‘Jugglers’, ‘copers’ and ‘strugglers’: academics’ perceptions of being a head of department in a post-1992 UK university and how it influences their future careers’, Journal of Higher Education Policy and Management https://doi.org/10.1080/1360080X.2011.585738

Kandiko-Howson, C and Coate, K (2015) The Prestige Economy and Mid-career Academic Women: Strategies, Choices and Motivation, Paper presented at the Society for Research into Higher Education Annual Research Conference, Newport, UK

Macfarlane, B and Burg, D (2019) ‘Women professors and the academic housework trap’, Journal of Higher Education Policy and Management 41(3): 262–274

Waddington, K (2016) ‘The compassion gap in UK universities’, International Practice Development Journal 6(1): 10