


by Zarus Cenac
On the SRHE Blog, in May and July, I wrote about the underrepresentation of Black people amongst professors in the UK higher education sector. In response to my May blog post, a commentator brought up the idea of a time delay between “the demographics of academia” and “changes in the wider population”, and that “estimating what is a reasonable lag is challenging and probably highly contestable” (Golding, 2026, para. 1). The present blog post takes a step along that path. There is an underrepresentation of Black female professors and Black male professors (Paper Whispers, 2025; Figure 1) – for females and males separately, I estimate how many years it may take for the underrepresentation of Black professors to end (Figure 2). This is done by estimating when the percentage of professors who are Black will eventually match Black representation in part of the UK population who are around a certain age (Figure 2). I also look for an indication of whether underrepresentation has been tangibly improving for Black female professors and Black male professors (Figure 2). Additionally, I consider which is the better of two similar methods for calculating the percentage of professors who are Black (eg, Figure 4a and 4b).
Figure 1
The Underrepresentation of Black Female Professors and Black Male Professors in UK Higher Education Institutions
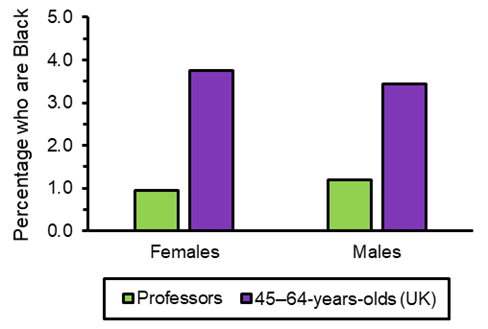
Note. Data (2024–25 academic year) from Higher Education Statistics Agency (HESA, nd-a) and 2021/2022 UK Census data (Office for National Statistics, 2025) were used regarding Figure 1 and in analysis. As before, statistical analysis was used to explore the representation of Black professors – see Box 1 for a description of this analysis.
Black representation over time: Professors
There have been observations on what the representation of Black professors looks like at different points in time (eg, Gibney, 2024; Rollock, 2025). For instance, between the 2021–22 and 2022–23 academic years, there was a 0.2% increase in the percentage of professors who are Black, with the percentage being 0.9% in 2022–23 (Gibney, 2024), and the percentage of female professors who are Black was 0.6% in 2019–20 and 0.8% in 2022–23 (Rollock, 2025).
I used HESA data for the academic years 2014–15 to 2024–25 (HESA, nd-a) to calculate the percentage of professors who are Black amongst females and amongst males (the green circles in Figure 2). Based on representation across those academic years, predictions were made for Black representation in academic years after 2024–25 by fitting a (quadratic) trendline to the data for females and for males – the trendline is the green, dotted line in Figure 2. Despite trendlines predicting a continued increase in Black representation in the professoriate, it should be expected that the percentage will plateau at some point (see the plateauing indicated in Figure 3 regarding non-professors).
Figure 2
Predicting When Black Professors are no Longer Underrepresented
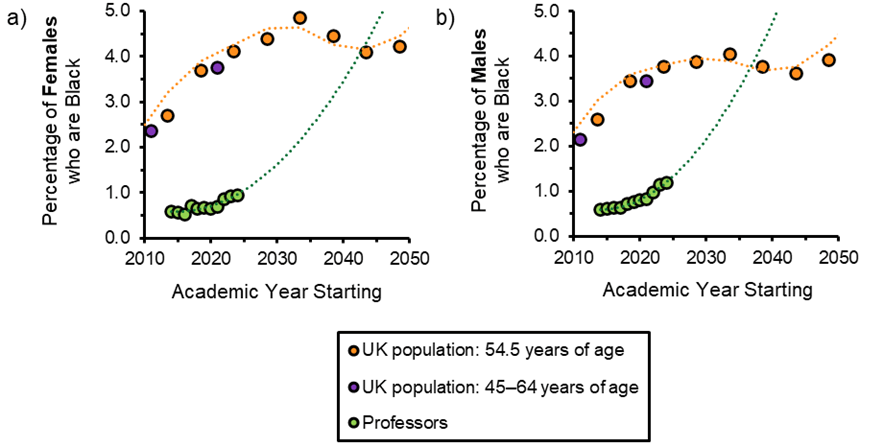
Note. Underrepresentation is predicted to end in the academic year when dotted lines cross. HESA (nd-a) data and 2021/2022 UK Census data (Office for National Statistics, 2025) were used for Figures 2 and 4. HESA (nd-a) state the number of professors by ethnicity categories: Asian, Black, Mixed, Other, White, and unknown ethnicity. In Figure 2 (and Figure 1), the representation of Black professors was calculated only using persons of known ethnicity. Additionally, using Census data (Nomis, 2013; Office for National Statistics, 2025), for females and males, Black representation amongst 45-to-64-year-olds in the UK was i) estimated for 2011 and ii) calculated for 2021/2022 (Box 2). For simplicity, census year (Office for National Statistics, 2025) was treated as the year when the academic year starts, eg, with the 2021/2022 Census data treated as the 2021–22 academic year.
Black representation over time: 54.5-year-olds in the UK population
The representation of Black people is lower in the professoriate than amongst people in the UK population who are between 45 and 64 years old – an age range which should reflect the ethnic composition of the professoriate well enough (Cenac, 2026). The midpoint of this age range is 54.5 years of age. For females and males, UK Census data are available for various ages and age ranges, for example, 15 years old, 50-to-54 years old, and 65-to-69 years old (Office for National Statistics, 2025). I estimated the year when ages and age ranges are 54.5 years old. To estimate when an age range is 54.5 years old, I calculated the midpoint of the age range, for example, the midpoint for the 50-to-54 age range is 52 years – the midpoint was used to represent the entire age range.
For ages and age ranges, UK Census data (Office for National Statistics, 2025) were used to calculate the percentage of females and males in the UK population who are Black. Figure 2 shows those percentages and the year in which the age/midpoint is 54.5 years old (orange circles). To estimate/predict what Black representation is like amongst 54.5-year-olds in the UK population for females and males at various times, a moving average line was used – the line can be seen in Figure 2 as a line which is orange and dotted.
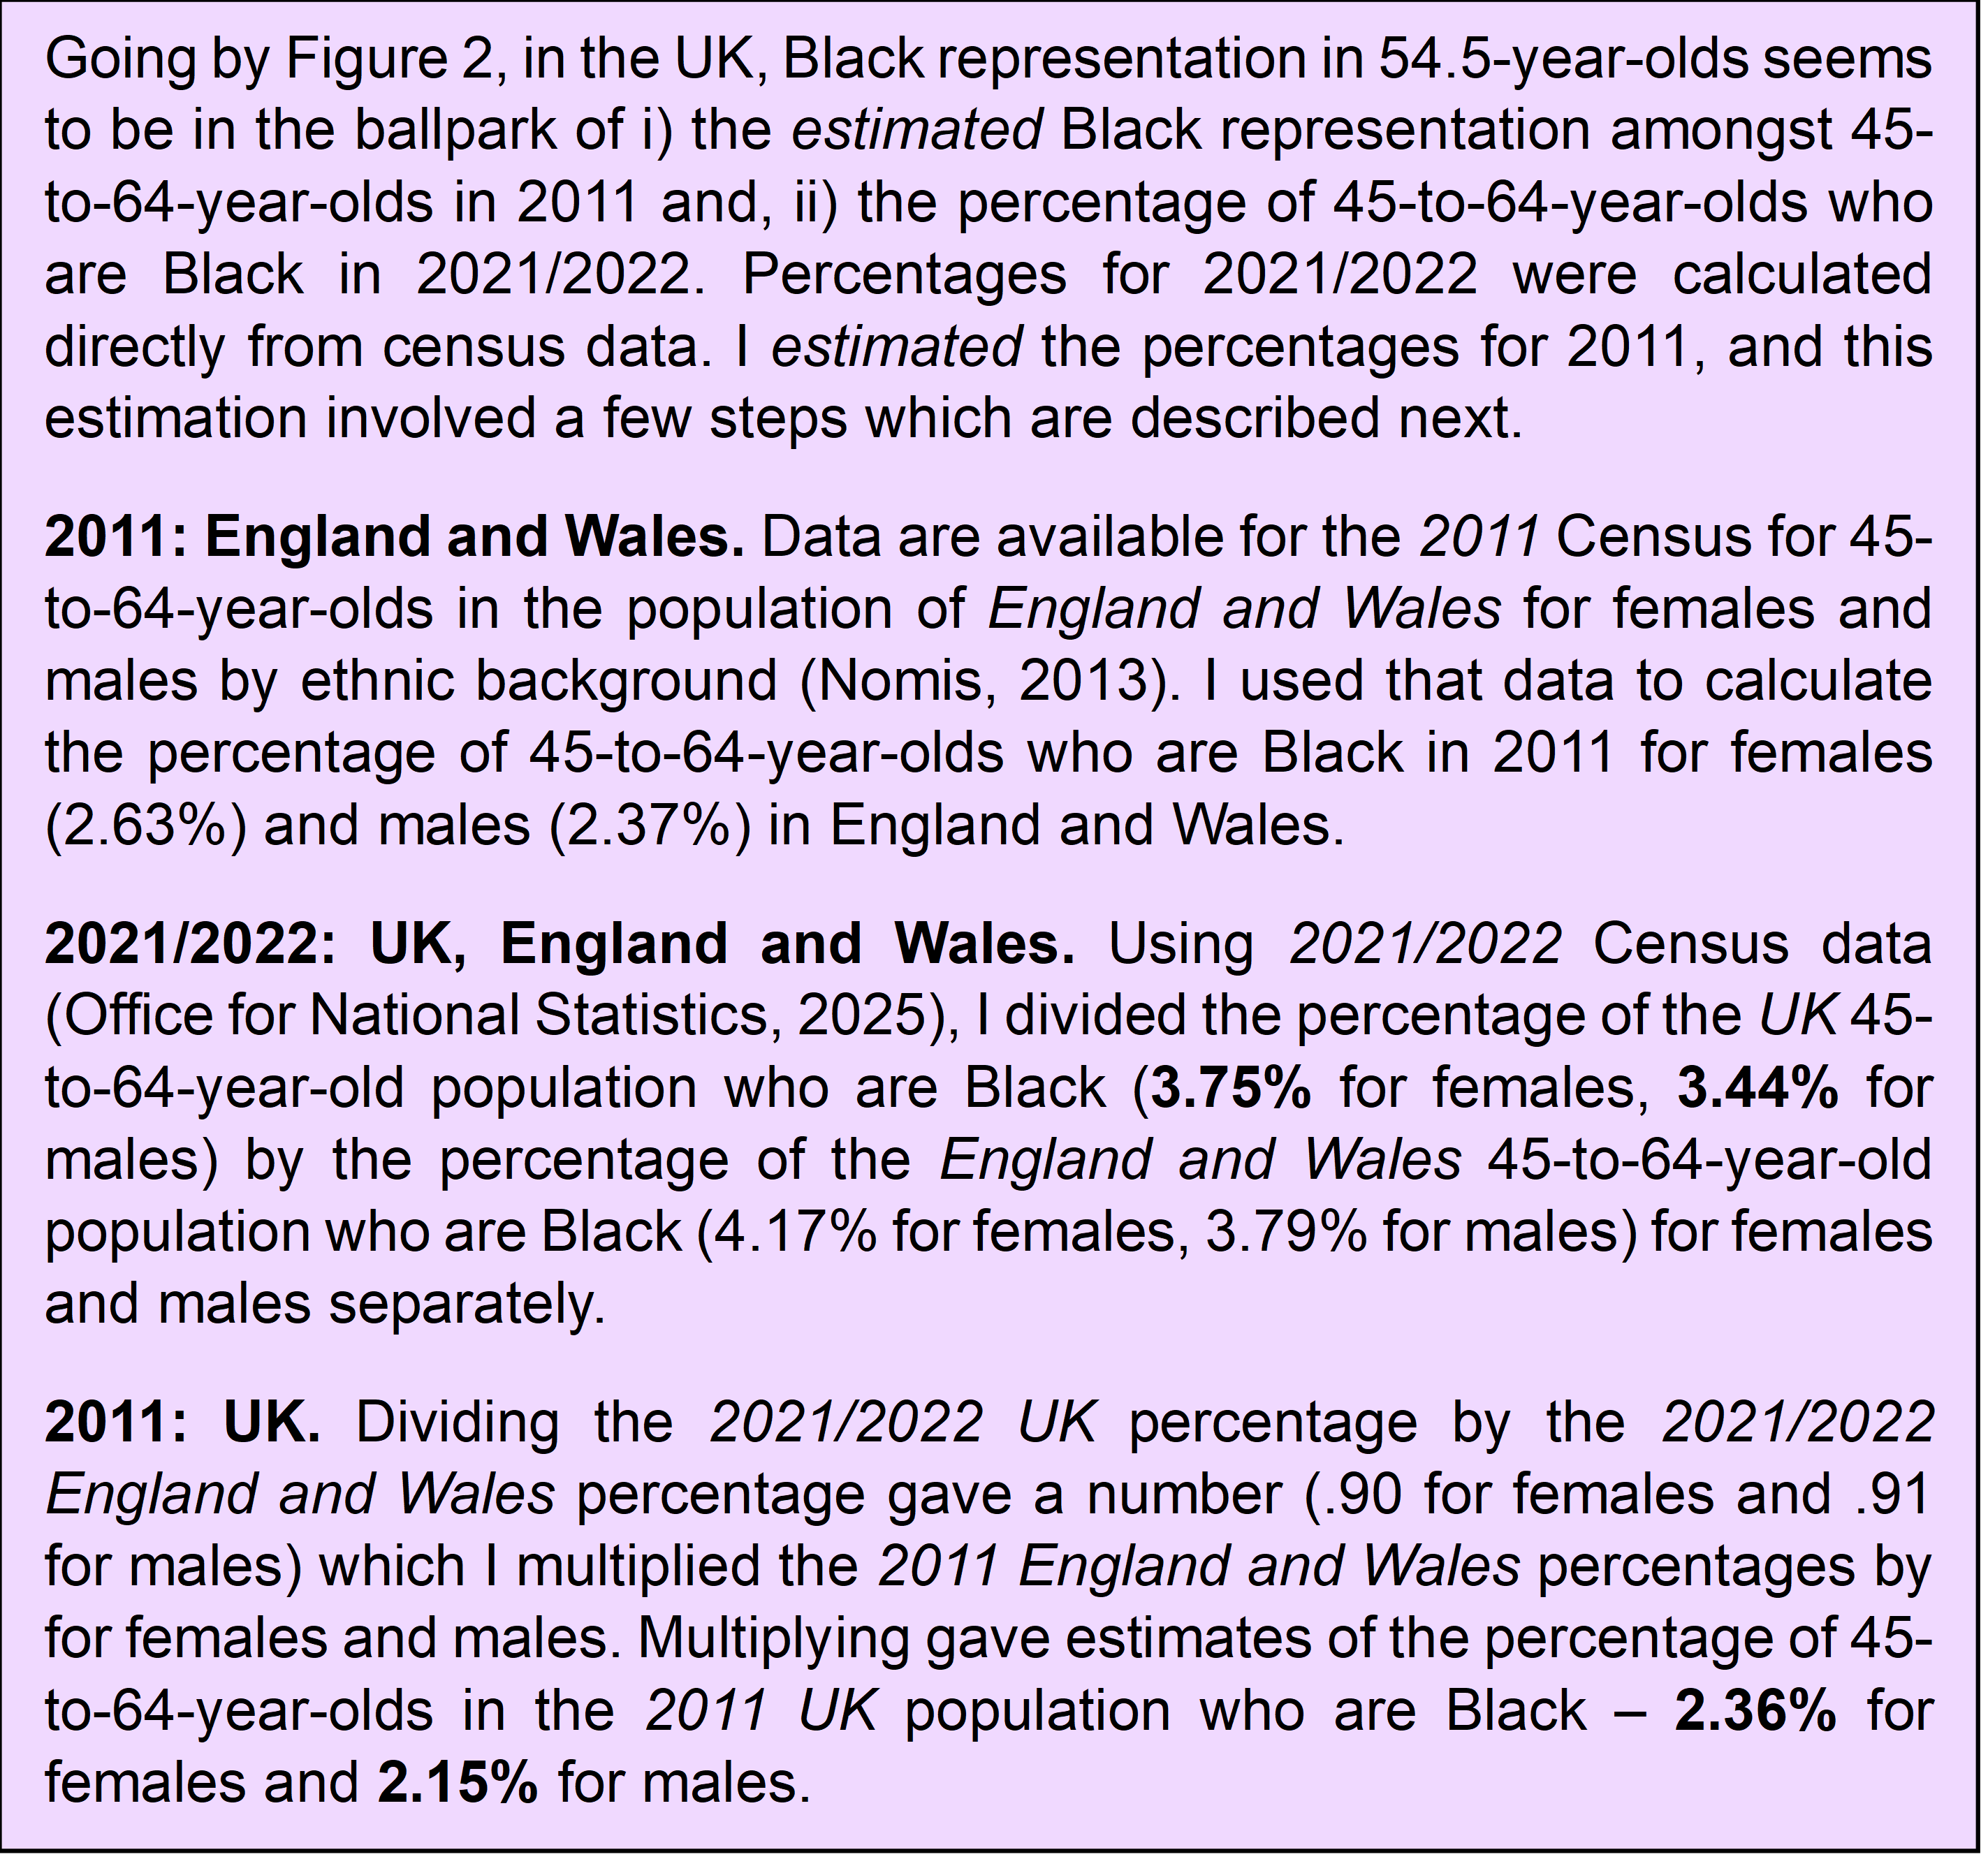
The estimated representation of Black people amongst 54.5-year-olds seems to be acceptable as a stand-in for Black representation in 45-to-64-year-olds in the UK in the recent past if we consider representation in 45-to-64-year-olds in 2021/2022 and estimated representation in 45-to-64-year-olds in 2011 (see Box 2).
Figure 3
Level of Black Representation in Non-Professors

Note. Data (which are of academics who are not professors) are from HESA (nd-a), and percentage representation was calculated from non-professors whose ethnicity is known.
Predicting an end to underrepresentation
The ethnic diversity of the UK has been predicted to be higher in 2051 than it was in 2001 (Rees et al, 2011). So, it should not be surprising that Black representation amongst 45-to-64-year-olds seems to have been increasing (see the purple circles in Figure 2). Therefore, when examining whether the underrepresentation of Black professors is improving, it is important to take into consideration changes in representation within the UK population (Figure 2). For females and males, between the academic years 2014–15 and 2024–25, the increase in the representation of Black professors does not seem to outpace the estimated increase in the representation of Black people who are around 54.5-years-old (Figure 2). Therefore, between those academic years, there appears to have been no tangible improvement in the underrepresentation of Black female professors and Black male professors.
It is possible to estimate the academic year when there will no longer be an underrepresentation. This can be done by seeing the academic year when dotted lines for professors and 54.5-year-olds cross over each other. That academic year is approximately 2043–44 for Black female professors and approximately 2037–38 for Black male professors. So, in the 2026–27 academic year, we are an estimated 17 years away from underrepresentation disappearing for Black female professors, and an estimated 11 years away for Black male professors.
Gains in Black representation amongst female and male academics who are not professors (Figure 3) suggest that there is reason to be optimistic that Black representation in the professoriate will increase for females and males. However, if Black representation amongst female non-professors is plateauing (at around 3.6%), then the trend amongst female non-professors (Figure 3a) does not bode well for an end to the underrepresentation of Black female professors by the early-to-mid 2040s (Figure 2a).
The percentage of professors who are Black, and the prediction of when underrepresentation disappears, depends on which of two (slightly different) methods is used to calculate the percentage (Figures 2 and 4). Using HESA data, the percentage of professors who are Black is calculated by dividing the number of Black professors by some sort of total number (eg, Gibney, 2024), and the two methods differ in how this total is defined (Figures 2 and 4).
Method 1: Known ethnicity only. When calculating the percentage representation of an ethnic group, or ethnic groups, the percentage can be calculated just from individuals for whom ethnicity is known (eg, HESA, 2026a). So, in this method, people of unknown ethnicity are not included in the total when calculating the percentage of professors who are Black (eg, Gibney, 2022; Figure 2).
Method 2: Overall. From looking at HESA (nd-a, 2026a) data, there seem to have been times when the percentage of professors who are Black (eg, Essilfie-Quaye et al, 2025; Gibney, 2024), or the percentage of female professors who are Black (Rollock, 2025), was calculated from a total number which includes people whose ethnicity is unknown. Under that method, when a percentage is calculated, a Black person could be part of the Black category or part of the unknown ethnicity category.
Compared to Method 1, Method 2 leads to a slightly lower percentage of professors who are Black (Figure 4a and 4b; also see Le Roux, 2022), and predicts that underrepresentation disappears a little further into the future (Figures 2 and 4). As briefly covered in my second blog post, the percentage of professors who are Black may seem smaller (but not very much smaller) than it really is. Method 2 would lead to a slightly further underestimation than Method 1 (Figure 4a and 4b). So, Method 1 may be a somewhat better method than Method 2 for considering the percentage representation of Black professors (eg, see Le Roux, 2022) and for estimating when underrepresentation will end.
Figure 4
Different Methods of Calculating the Percentage of professors who are Black
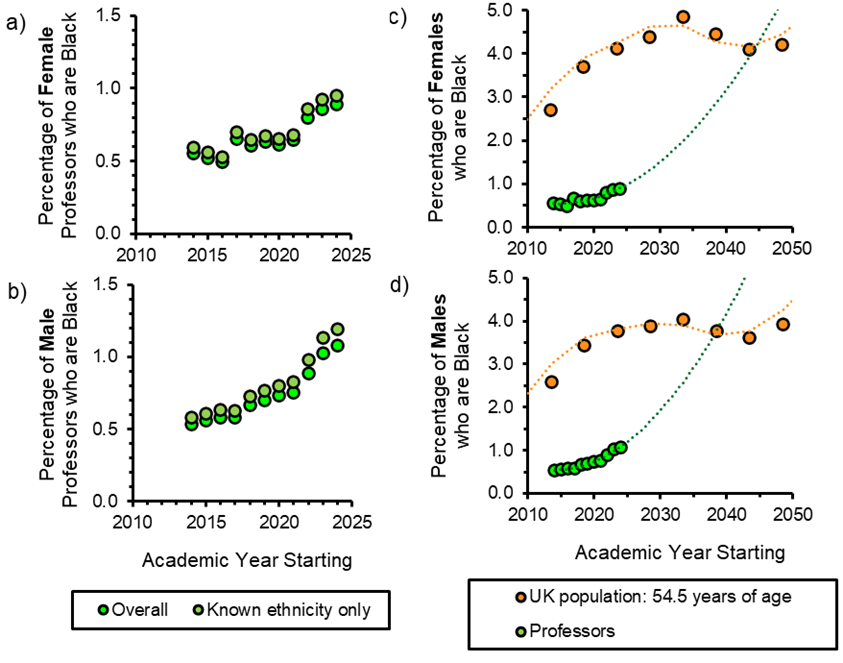
Note. For Figure 4c and 4d, analysis regarding Figure 2 was undertaken again, but without limiting analysis to professors of known ethnicity – it is predicted that Black professors will no longer be underrepresented by 2045–46 for females and 2038–39 for males. Considering data and literature (HESA, nd-a; Rollock, 2025), some of the percentages for Black female professors (overall) in Figure 4a are in Rollock (2025) to one decimal place.
Context and future research
There seems to be a dearth of literature which examines how percentage representation changes with time in academia and in the national population to see whether the extent of ethnic/racial underrepresentation in academia changes. So, it is hoped that the approach used in the present blog (Figure 2) is useful for exploring the underrepresentation of ethnic/racial groups in academia outside of Black professors. In previous research, a graph has shown 1) the number of geoscience PhDs gained by people in specific (underrepresented) ethnic/racial groups for various years (amongst the USA’s citizens or people with permanent residency in the country) and 2) the number of people in ethnic/racial groups in the USA for various years (Bernard & Cooperdock, 2018). The graph has been referred to when stating that, when considering four decades, “the representation of students from underrepresented minorities … has essentially been stagnant when compared with the proportion of the relevant groups in the US population” (Bernard & Cooperdock, 2018, pp. 292–293); the present blog post examines the percentage representation of Black people in the professoriate and in the UK population (Figure 2) – if not done so already, it may be useful to examine (across the years) the percentage representation of ethnic/racial groups in academia beyond the Black professoriate (eg, in achieving PhDs) alongside percentage representation at the national population level for an indication of whether ethnic/racial underrepresentation is changing and when the underrepresentation may stop.
In my first blog post, I described how a statistic known as Cohen’s h can quantify the extent that Black professors are underrepresented, and I considered how that statistic can be used to define when underrepresentation is no longer large enough to be noteworthy. Therefore, Cohen’s h could be used to estimate the academic year when the difference between Figure 2’s orange and green lines is no longer noteworthy – that year would likely be sooner than the year when underrepresentation is forecasted to stop.
Whilst this blog post predicts when underrepresentation will end for Black female professors and Black male professors (Figure 2), these predictions are not intended to be conclusive. Ideally, future census data (Northern Ireland Statistics and Research Agency, 2026; Office for National Statistics, 2026; Scotland’s Census, 2025) and HESA data (HESA, 2026b) will be used to update these predictions in the approaching years. Moreover, previous research on predicting the future representation of ethnic groups in the UK (Rees et al, 2011) suggests that the method for predicting an end to underrepresentation (Figure 2) can be refined.
Conclusion
There has been an increase in the percentage of the professoriate who are Black (Gibney, 2024). Nevertheless, there does not appear to have been a reduction in the underrepresentation of Black female professors or Black male professors between 2014–15 and 2024–25 (Figure 2). Despite this lack of reduction in underrepresentation, it is provisionally predicted that the underrepresentation of Black female professors and Black male professors will end in 2043–44 and 2037–38 respectively. However, the prediction for Black female professors seems unlikely given the plateauing indicated in the representation of Black female non-professors (Figure 3a). Hopefully, predictions will be strengthened through subsequent data and improved methodology; it is intended that this blog post encourages efforts to monitor and predict the underrepresentation of Black professors over time so that there can be a clear idea of where the situation is heading.
Box 1
Statistical Analysis: Underrepresentation

Note. References: Advance HE (2024), Cohen (1988), HESA (nd-a, nd-b, 2026a), Office for National Statistics (2025), R Core Team (2025), Zieffler (2025), my first and second blog posts.
Box 2
Black Representation in 45-to-64-year-olds in the UK: 2011 and 2021/2022
Note. References: Nomis (2013), Office for National Statistics (2025).
References
Cohen, J. (1988). Statistical power analysis for the behavioral sciences (2nd ed.). Lawrence Erlbaum Associates.
Zarus Cenac has worked at UK universities, for example, he was a visiting lecturer at City, University of London. He is currently an administrator at UCL. His interests include race and ethnicity from an interdisciplinary perspective.
